The Surprise in the Logarithm Tables
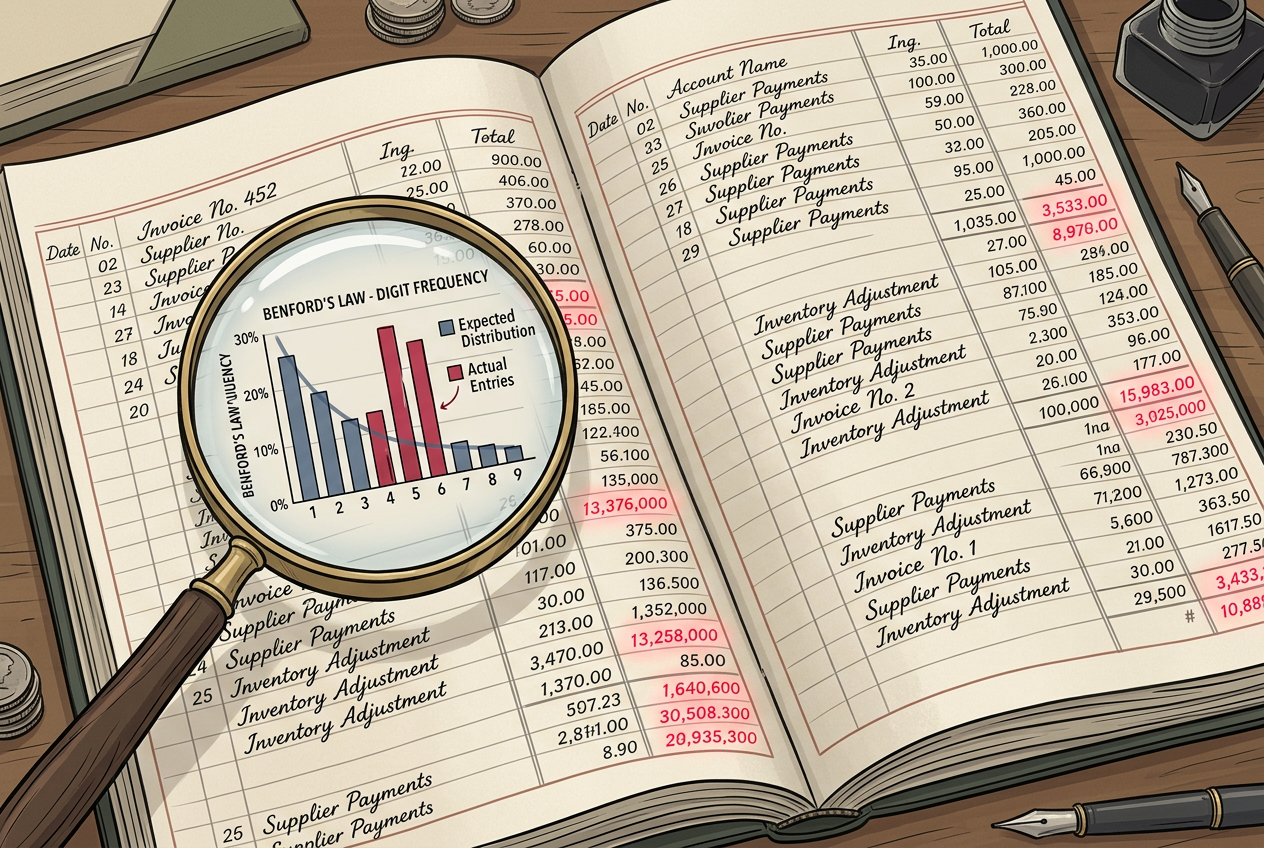
In 2001, a forensic accountant named Darrell Dorrell was picking through the wreckage of one of the largest corporate frauds in American history. Enron had filed for bankruptcy, and its financial statements — once praised by analysts — were now suspect, every line item a potential lie. Dorrell didn't start by reading the numbers. He counted their first digits.1
Here's what he found: the leading digits of Enron's reported revenue line items were suspiciously uniform. The digit 1 showed up about as often as the digit 7. The digit 3 appeared with roughly the same frequency as the digit 8. The distribution was flat — democratic — as if someone had assigned first digits at random.
This is exactly what you'd expect if humans were making numbers up. It's also exactly what doesn't happen in the real world.
Dorrell was using a technique based on a mathematical curiosity called Benford's Law, and it told him — before anyone cracked open a single receipt — that the books had been cooked. Not because any individual number looked wrong, but because the texture of the numbers was inhuman.
The IRS uses Benford's Law. So does the FBI. So do state tax agencies in New York, California, and a dozen other states. It's been admitted as evidence in criminal fraud trials. And it all rests on a fact about numbers that seems, the first time you hear it, completely insane.
In 1881, the astronomer Simon Newcomb noticed something peculiar about the book of logarithm tables in his observatory's library. The first pages were dirtier and more worn than the later ones. People looked up numbers starting with 1 far more often than numbers starting with 9.2
This is bizarre. Why should the universe care what digit your number starts with? If you picked random numbers — truly random, from a hat — each digit from 1 through 9 would come up about 11% of the time as a leading digit. Perfectly uniform. But Newcomb saw that real-world numbers don't work this way, and he proposed a formula:
Benford's Law
P(d) = log10(1 + 1/d)
The probability that a number's first digit is d
- P(d)
- Probability of first digit being d
- d
- A digit from 1 through 9
- log₁₀
- Base-10 logarithm
Newcomb published this observation, and the world ignored it. Fifty-seven years later, in 1938, a physicist at General Electric named Frank Benford rediscovered the same pattern — independently — and tested it against 20,229 observations drawn from river surface areas, population figures, baseball statistics, and the numbers appearing on the front pages of newspapers.3 Every dataset followed the logarithmic distribution. The law was named after him. Newcomb, who got there first, got nothing.
Scale Invariance: The Key to Everything
You might think Benford's Law is just a curiosity — a fun fact for cocktail parties, like the birthday paradox. But actually, it has a deep mathematical reason for existing, and understanding that reason is the difference between memorizing a trick and grasping a truth.
Imagine you have a list of the GDPs of every country on Earth, measured in US dollars. The first digits follow Benford's Law beautifully. Now convert every GDP to euros — multiply each number by, say, 0.92. Does the first-digit distribution change?
It shouldn't. The economic reality hasn't changed — you just relabeled the units. Benford's Law should hold regardless of whether you measure in dollars, euros, yen, or coconuts. This property is called scale invariance: the distribution of first digits shouldn't depend on the unit of measurement.
Here's the deep fact: the only first-digit distribution that is scale-invariant is Benford's logarithmic distribution.8
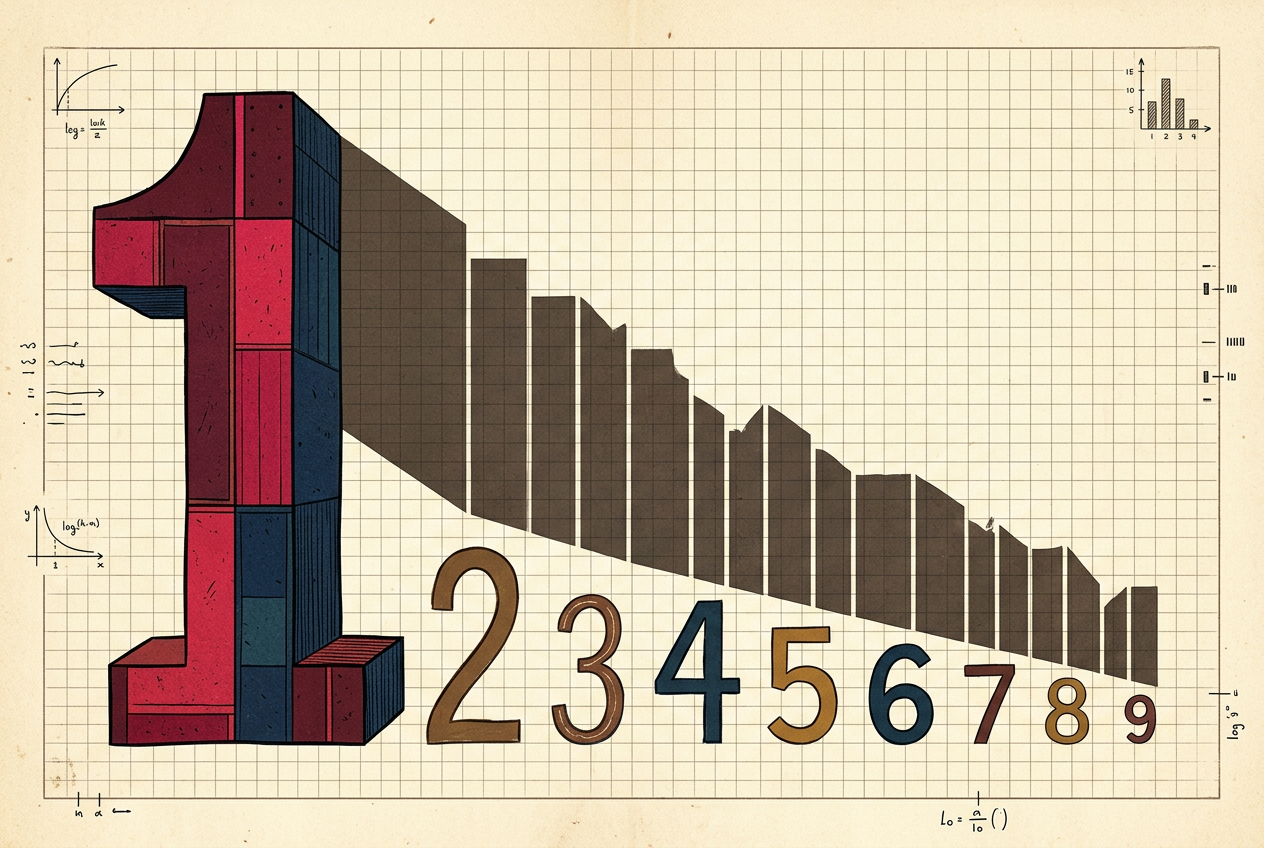
On a logarithmic ruler, low digits occupy more space than high digits. The digit 1 owns 30.1% of the ruler. The digit 9 owns 4.6%. If real-world quantities are spread roughly evenly across the logarithmic scale — which they are, because natural processes tend to grow multiplicatively rather than additively — then the first digits must follow Benford's.
Think about populations. A city grows from 100,000 to 200,000 — that took a doubling. Growing from 800,000 to 900,000 is only a 12.5% increase. In the time it takes a city to double (clearing the entire "1" territory on the logarithmic ruler), another city might barely nudge from 8-something to 9-something. So at any given snapshot, more cities have populations starting with 1 than with 9.
Key Insight
Benford's Law works for river lengths, stock prices, street addresses, electricity bills, death rates, physical constants, and the areas of lakes. Anything generated by a process that multiplies rather than adds — and most natural processes are multiplicative — will follow the law. And this is precisely why fabricated numbers don't.
Why Liars Get Caught
When humans invent numbers, we do something very natural and very wrong: we make them too uniform. Ask someone to write down 200 "realistic" expense report amounts, and they'll distribute their first digits roughly equally. The fabricated data will look too fair — too democratic — and that fairness is the tell.
To formalize the detection, you'd run a chi-squared goodness-of-fit test — comparing the observed distribution to the Benford prediction. Now try it yourself:
Benford's Law Tester
Choose a preset dataset or paste your own numbers to test against Benford's Law.
| Digit | 1 | 2 | 3 | 4 | 5 | 6 | 7 | 8 | 9 |
|---|
Elections, Epidemics, and Scientific Sins
In June 2009, Iran held a presidential election. The incumbent, Mahmoud Ahmadinejad, was declared the winner with 63% of the vote — a result that triggered massive street protests. Two political scientists, Bernd Beber and Alexandra Scacco, didn't just look at the vote totals. They looked at the last two digits of the vote counts reported from each district.4
They found that the digit distributions in the official Iranian results were significantly non-random. The pattern was consistent with hand-manipulated numbers — someone had adjusted the totals, and they'd done it clumsily enough that the digits gave them away. (Some scholars have argued that Benford-style tests alone aren't sufficient for election fraud detection — the structure of vote-count data doesn't always span enough orders of magnitude.5 But Beber and Scacco's approach targeted the last digits, where uniformity is expected, and found suspicious clustering instead.)
Scientific fraud: In 2016, researchers analyzed datasets from hundreds of published psychology papers and flagged those whose summary statistics significantly deviated from Benford's predictions. Several of the flagged papers turned out to have fabricated data — confirmed by later retractions.6
Greek debt crisis: Researchers applied Benford's Law to Greece's macroeconomic submissions to the EU. The data deviated significantly — consistent with the later revelation that Greece had systematically misrepresented its deficit figures.7
Now it's your turn to play detective.
🔍 Fraud Detector
One dataset is real, one is fabricated. Can you spot the fake?
Dataset A
Dataset B
The Limits and the Lesson
Benford's Law is powerful, but it's not magic. It works best on data that spans several orders of magnitude — populations that range from thousands to millions, financial amounts from $10 to $10,000,000. It doesn't work well on data constrained to a narrow range (human heights, IQ scores, hourly temperatures). And critically, it doesn't prove fraud — it flags anomalies that demand investigation.
There's also an arms race. As Benford's Law has become more widely known, savvier fraudsters have started engineering their fake numbers to match the expected distribution. This doesn't make Benford's useless — it means investigators now use second-digit tests, digit-pair analysis, and other extensions that are harder to game simultaneously.
The Deeper Lesson
We live in a multiplicative universe. Things grow and shrink by percentages, not by fixed amounts. The universe operates on multiplication, and multiplication means logarithmic spacing, and logarithmic spacing means Benford's Law. The law catches liars because liars think additively — they space numbers evenly on a flat number line. But the real number line is logarithmic, curved, stretched at the bottom and compressed at the top.
Simon Newcomb noticed it in the worn pages of a book. Frank Benford proved it across twenty thousand data points. And today, a forensic accountant can glance at a spreadsheet and see what no auditor examining individual entries would catch: the ghostly signature of fabrication, hiding in plain sight in the first digit of every number.