You've noticed it. The people you date who are gorgeous tend to be terrible. And the wonderful, funny ones? Never quite the full package. You're not wrong about the pattern. But the correlation isn't real. It's a phantom — conjured entirely by the way you selected who to observe.
The Hot-Jerk Paradox
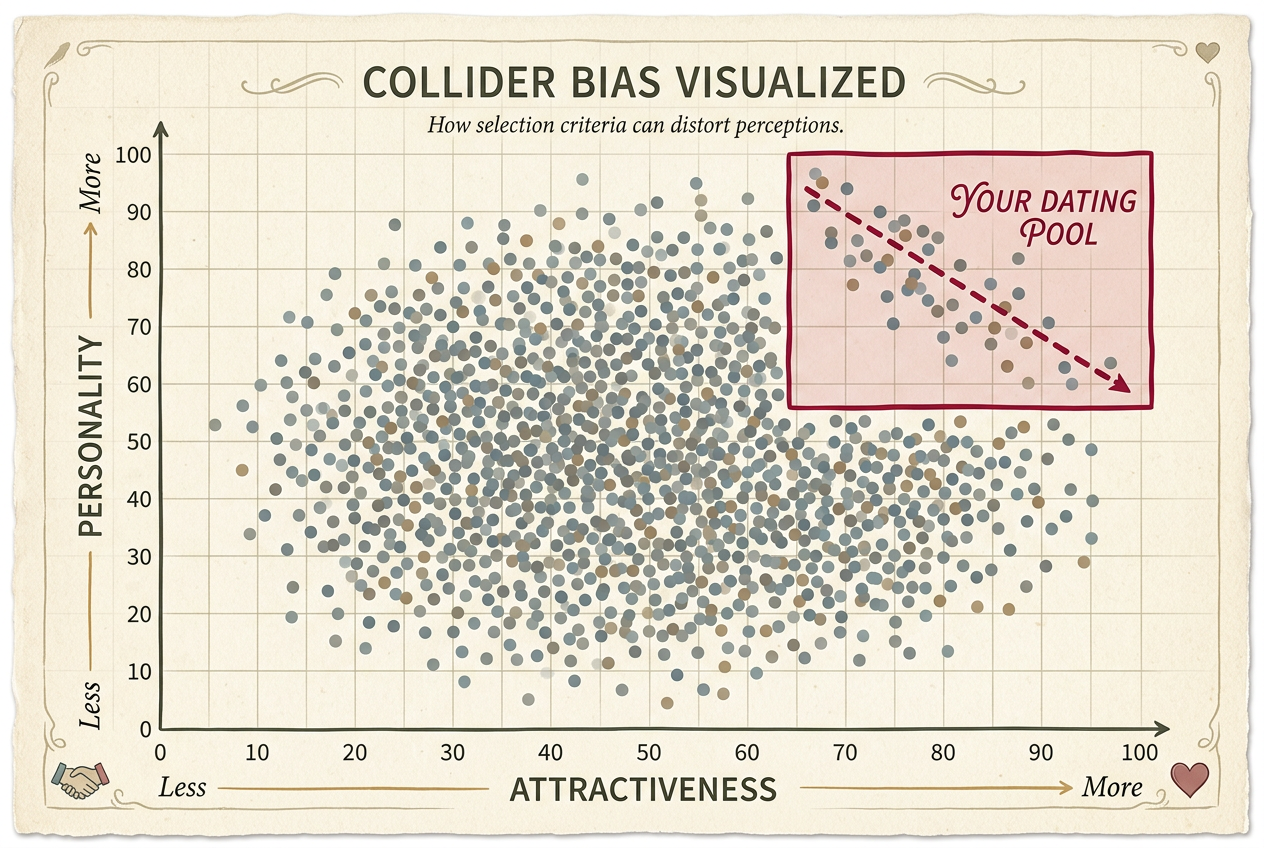
Imagine every person your age on a two-dimensional chart. X-axis: attractiveness. Y-axis: personality. In the full population, these two things are completely unrelated. The scatter plot is a big, uniform cloud with zero correlation. Some people are blessed with both. Some got neither. Most are somewhere in the middle.
But you don't date the full population. You have a threshold — maybe not conscious, but it's there. You'll go on a date with someone if they clear a bar on the combined score. Gorgeous but dull? Sure. Plain but outrageously charming? Also yes. Plain and boring? Swipe left. Awful in both dimensions? Filtered out before they reached your consciousness.
Now look at what's left. Among your dating pool, there is a negative correlation. People who got in on looks tend to have weaker personalities, and vice versa. The math is inexorable: if someone made it into your life on raw hotness alone, they didn't need personality to clear the bar.
A genuine pattern in your data — that doesn't exist in reality. The attractive people you date aren't actually meaner than average. The correlation is a mathematical artifact, like a mirage. It looks real. It behaves like real data. You can measure it, graph it, run regressions on it. But it's a ghost.
You just met Berkson's paradox.1
The Hospital That Created a Disease
Joseph Berkson, a biostatistician at the Mayo Clinic, published a short, devastating paper in 1946. It was only four pages. The argument was clean, elegant, and troubling for anyone who trusted hospital records.
Suppose you want to know whether disease A (diabetes) is associated with disease B (gallbladder inflammation). You look at hospital records. Both diseases independently increase the probability of being hospitalized. A person with neither disease is unlikely to be in the hospital. So restricting your study to hospital patients creates a spurious negative association between the diseases.2
Here's the mechanism: Among hospital patients, someone with diabetes might be there despite not having gallbladder issues — because the diabetes was enough to get them admitted. Someone with gallbladder problems might be there despite not having diabetes. Someone with neither? Probably not in the hospital at all. The result is that the diseases appear to repel each other in hospital data, even though in the general population they're independent or even slightly positively associated.
Berkson was warning that a perfectly valid statistical method — looking at associations in a dataset — could produce perfectly wrong conclusions if that dataset was selected in the wrong way. The hospital isn't a random sample of humanity. It's a filter. And filters create correlations.
The structure is a collider — two independent causes pointing at a shared effect. Trouble starts when you condition on it — restrict your analysis to cases where the effect happened.
The Geometry of a Phantom
Picture a square: x-axis from 0 to 100, y-axis from 0 to 100. Every point is a person with random attractiveness and random personality. No correlation.
Now draw a line: everyone whose combined score exceeds a threshold makes it into your world. Everything below? Invisible.
The shape of what's left is a triangle — the upper-right region. Within it, the points have a strong negative correlation. The selection constraint mechanically induces a negative relationship. It's geometry: if you're constrained to where x + y > c, then high x allows low y and vice versa.3
The Phantom Correlation Machine
500 random people with zero correlation between attractiveness and personality. Drag the threshold to select only those above the bar.
The negative correlation in your sample is statistically real. A regression would find a significant negative coefficient. The p-value would be tiny. A careful scientist analyzing only the visible data would conclude, with high confidence, that the traits are negatively related. They'd be wrong about the world but right about their data. The bias isn't in the analysis — it's in the sample.
This is what makes Berkson's paradox so insidious. The data looks clean. The statistics look solid. The correlation coefficient is just sitting there, real as rain. But it's a phantom — a shadow cast by the selection process, not a reflection of reality.
Phantom Correlations Everywhere
Restaurants. Delicious food with terrible ambiance, or beautiful atmosphere with mediocre food? You don't eat at restaurants bad at both. Your filter creates the tradeoff. The cozy hole-in-the-wall with amazing tacos doesn't need stunning decor. The fancy rooftop with the view doesn't need Michelin-starred cuisine.4
Hollywood. Attractive but untalented actors. Talented but plain actors. The population on screen cleared an impossibly high bar. If you're stunning, you don't need to be Olivier to get cast. If you're a virtuoso, you don't need to be a supermodel. Both made it, but through different doors.
Academic publishing. Small studies report larger effects. Publication bias as Berkson's paradox: to get published, a small study needs a large effect, a large study needs only a modest one. Conditioning on publication creates a spurious negative correlation between sample size and effect size.5
Hiring. Among employees who cleared a combined interview bar, those strong on technical skills appear weaker on communication — not because the traits are negatively correlated in the population, but because the hiring bar imposed the tradeoff.
Airlines. Why do budget airlines seem to have worse on-time performance? They fly from cheaper, more congested airports. The selection into "airlines you consider" filters on price and convenience. Conditioning on your consideration set creates phantom correlations.
Real or Phantom?
Eight observed correlations. Is each one a genuine relationship or a Berkson's paradox artifact from selection?
The Deepest Trap
Here's the thing about Berkson's paradox: it violates a principle that usually serves us well. We trust our experience. We trust large datasets. We trust that if we see a pattern clearly, repeatedly, across many cases, that pattern is telling us something about the world.
Berkson's paradox laughs at that trust. Even a huge dataset can show a pattern that is 100% real in your data and 100% false in the world. The data isn't noisy — it's structurally filtered. Every observation is real. Every measurement is accurate. The correlation is mathematically genuine. And it's completely wrong as a description of reality.
You can't fix it by collecting more data from the same filtered source. A thousand more dates won't resolve the hot-jerk paradox if your dating pool is selected the same way. More data from the same biased source just gives you more confidence in the wrong answer.
Before asking "what does the data show?", ask: "why is this data in my sample?" What filter produced it? Could two independent things both affect the probability of passing through that filter? If yes, suspect Berkson's.
The Personality of Numbers
There's a deeper philosophical point here about the personality of numbers. We tend to think of statistics as objective — numbers don't lie, as the saying goes. But numbers are context-dependent. A correlation coefficient of -0.7 means one thing in a random sample and something entirely different in a selected sample.
Berkson's paradox reveals that the same mathematical object — a correlation between two variables — can be either a window into reality or a mirror reflecting our selection criteria back at us. The difference isn't in the math. It's in the story of how the data came to be.
This is why causal inference matters. It's not just about fancy methods. It's about asking the right questions before you calculate. Where did this data come from? Who's not in my sample? What gate did everyone have to pass through to get here?
Seeing Through the Phantom
Every time you generalize from a non-random sample — from the people you know, the restaurants you've visited, the news you've read — you are potentially conditioning on a collider. Your sample is never the full population. It's always filtered through something.
This doesn't mean all observations are worthless. It means you need to be explicit about the filter. When you notice a pattern, ask: who am I not seeing? What would disprove this pattern?
If you think attractive people are mean, go find some unattractive people and see if they're nicer. (Spoiler: they're not.) If you think small restaurants have better food, try a few mediocre holes-in-the-wall. They're out there; you just haven't been selecting for them.
Joseph Berkson published his paper almost eighty years ago. Four pages. No advanced mathematics — just a clean argument about conditional probability and a warning about study design. The bias he identified continues to corrupt research, analysis, and everyday reasoning, because the data looks right.6
The universe isn't enforcing a tradeoff between beauty and kindness. You're just not dating the ugly, boring people who would prove it.7
The next time someone tells you that "the data shows" a surprising negative correlation, ask them about the door. Ask who didn't make it through. That's where Berkson's paradox hides.
See the phantom for what it is, and you'll see through it. That's the only way to not be wrong.