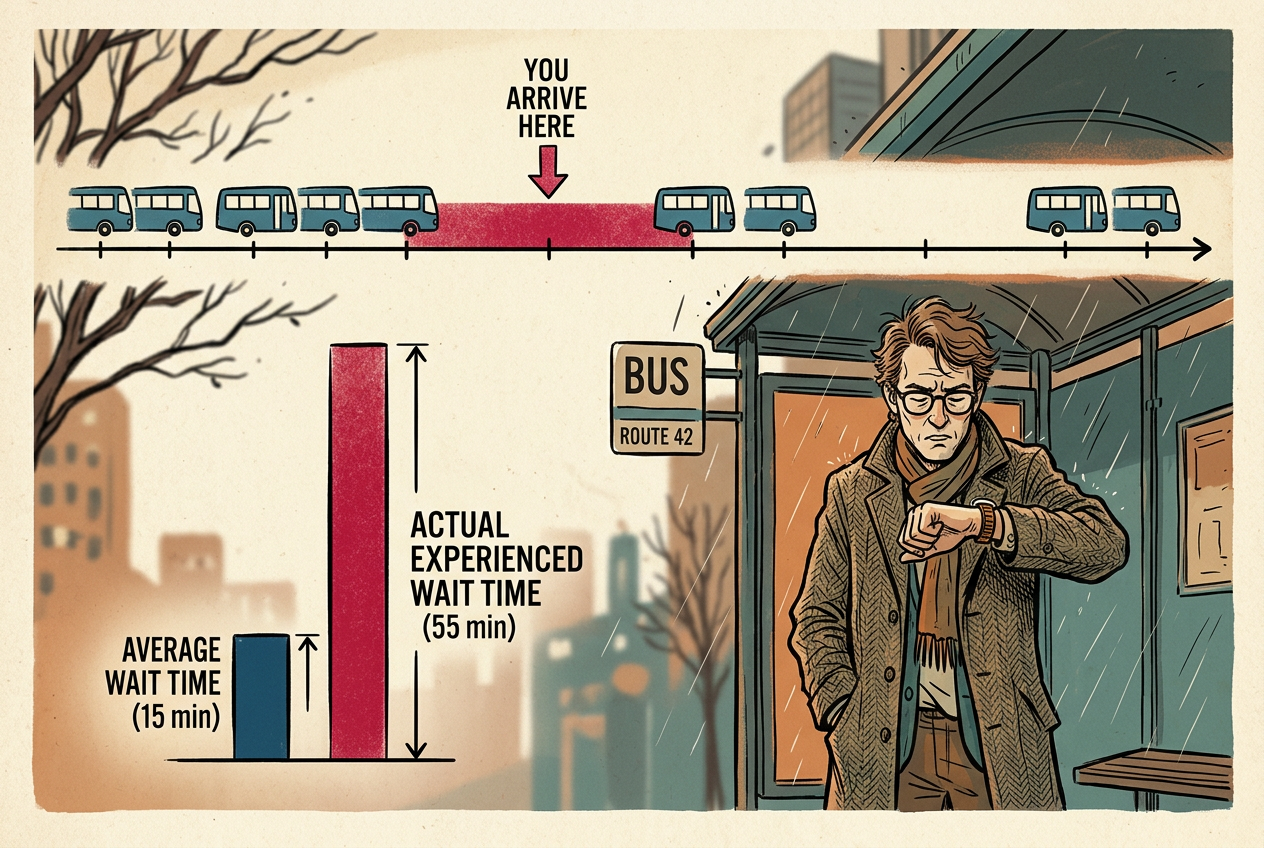
It's 8:47 a.m. on First Avenue. The M15 bus runs every ten minutes, but you've been waiting for twelve. You always seem to land in one of those mysteriously long gaps. Your friends report the same. The MTA might be telling the truth — it's not bad luck or incompetence. It's mathematics. They call it the inspection paradox.
The Trap Inside "Average"
A perfectly regular bus arrives every 10 minutes. Show up at a random time: your expected wait is 5 minutes. Fair.
Now make it realistic. Buses still average 10 minutes between arrivals, but with variation. Sometimes 3 minutes, sometimes 22 minutes. The average is still 10.
Your gut says: average gap is 10, so average wait should be about 5. But your gut is wrong. The error is deep enough to have fooled professional statisticians for decades. In 1907, the Danish mathematician Agner Krarup Erlang — the father of queueing theory — puzzled over why telephone operators seemed to wait longer than theory predicted.7 It wasn't the telephones. It was the sampling.
The intuition runs deeper than you might expect. Consider this: if buses arrived randomly according to a Poisson process (the classic model where events happen independently at a constant average rate), your expected wait would be exactly equal to the average gap — not half of it. Ten minutes between buses on average means you wait ten minutes on average. That's not a bug; it's a fundamental property of randomness.
Imagine a day's worth of bus intervals on a timeline — a 3-minute gap, a 22-minute gap, a 7-minute gap. Throw a dart at random. Your dart is more likely to hit the 22-minute gap because it's physically wider on the timeline. This isn't a metaphor. The 22-minute gap occupies 22 minutes of the day; the 3-minute gap occupies 3. Your probability of landing in a gap is exactly proportional to its duration.
Here's the kicker: even if you know this, you still can't escape it. The paradox isn't about ignorance; it's about the structure of time itself. Every time you step up to that bus stop, you are, in effect, throwing that dart. You cannot choose to arrive only in short gaps because you don't know where they are. By the time you arrive, the die is cast.
This is length-biased sampling. When you sample a point from a process, you're more likely to "inspect" a long interval simply because long intervals present a bigger target.1
The term "inspection paradox" itself comes from reliability engineering, where inspectors would examine a random sample of lightbulbs or machine parts to estimate their average lifespan. They'd run the items until failure and compute the average. But if you instead walk onto a factory floor and sample bulbs that are currently in use, you'll systematically overestimate their lifespan — you're more likely to catch a long-lasting bulb in the act of burning.
Bus Arrival Simulator
See how regular vs. random bus schedules create different average wait times. All modes have the same 10-minute average interval.
Average Bus Interval
Your Average Wait
The University's Little White Lie
A small university offers five courses: 10, 10, 10, 10, and 160 students. The university says average class size is (10+10+10+10+160)/5 = 40 students.
But ask the students. Of 200 total, 160 — 80% — will answer "160." Only 40 students across four small classes will answer "10." The average class size as experienced by a typical student is:
(40 × 10 + 160 × 160) / 200 = 130 students
The university says 40. The students say 130. Nobody's lying. It's length-biased sampling again: large classes get sampled in proportion to their size because more students are in them.2
This isn't just a statistical curiosity — it has real consequences for education policy. A university can game its rankings by maintaining a portfolio of tiny seminars alongside massive lectures. The reported "average class size" looks intimate and appealing to prospective students, while the actual experience of most undergraduates is sitting in a 200-seat auditorium watching a professor click through PowerPoint slides from a hundred feet away.
The paradox works in reverse too. If you're a professor considering where to teach, the average class size you experience (looking at your own schedule) will be larger than the institutional average. Why? Because professors with heavier teaching loads appear in more data points. A professor teaching five large sections has five chances to be sampled; a professor on sabbatical has zero. The professors you meet at a conference will, on average, teach larger classes than the university average suggests.
Class-Size Paradox Calculator
Enter class sizes (comma-separated) to see the gap between university-reported average and student-experienced average.
University Average
Student-Experienced
College rankings report the university's number, not the student's. A school can truthfully advertise "average class size 20" while stuffing most students into giant lectures — as long as it also offers tiny seminars that almost nobody takes. The U.S. News & World Report rankings, for all their methodological sophistication, fall prey to this exact bias when they survey schools about their class sizes. They ask administrators, not students.
Your Friends Are More Popular Than You
In 1991, sociologist Scott Feld published a paper with one of the great academic titles: "Why Your Friends Have More Friends Than You Do."3
On average, across any social network, the mean number of friends your friends have is greater than your own number of friends. It's not that you're unpopular. It's the inspection paradox.
Feld's discovery sent ripples through sociology because it explained a persistent puzzle: why do people consistently report that their social circles seem more connected than they are? The answer is structural, not psychological. It's not envy or low self-esteem. It's mathematics.
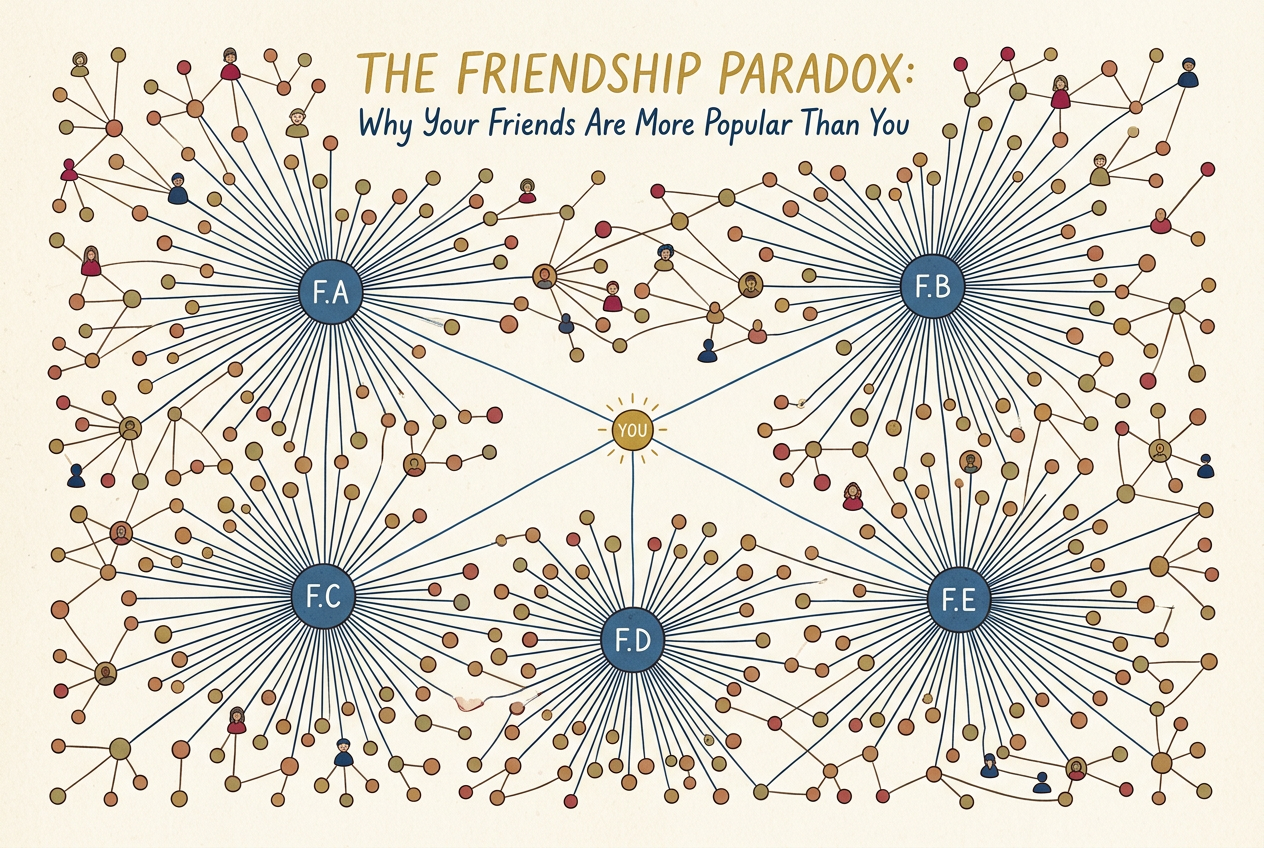
When you look at your friends list, you're sampling the network in a biased way. People with many friends appear on more people's friend lists. A person with 500 Facebook friends shows up as "friend" 500 times; a person with 3 friends shows up 3 times. Popular people are the wide intervals on the timeline. You are the random dart.
Think of it this way: imagine a party with 100 people. Ninety-nine of them have one friend at the party (the host). The host has 99 friends at the party. Pick a random person: they almost certainly have one friend. Pick a random person and ask how many friends *their* friends have: you'll get 99 (the host) every single time. The friends-of-friends average is 99; the friends average is 1.98.
The friendship paradox holds even in networks where everyone has exactly the same number of friends — as long as there's any variation at all. In fact, the more unequal the network (the more "scale-free" it is, in the jargon), the stronger the effect. In a social network with a few celebrities and many isolates, almost everyone will find that their friends are better-connected than they are.
In 2010, researchers demonstrated that tracking a random sample of Harvard students' friends detected the H1N1 flu outbreak two weeks earlier than tracking a random sample of students.4 The inspection paradox, weaponized for public health. By monitoring the more-connected individuals in a network, disease surveillance can act as an early warning system, catching outbreaks before they reach the general population.
Renewal Theory, or: The Mathematics of Arriving in the Middle
Everything we've discussed — the bus, the classes, the friends — is a special case of renewal theory, the study of processes where events happen repeatedly and you parachute in at a random point.5
The central result: the interval you land in is stochastically larger than a randomly chosen interval. The entire distribution of what you experience is shifted toward larger values. This isn't just about means; the entire shape of the distribution changes when you sample by inspection rather than by selection.
Epidemiology: Survey hospitalized patients to estimate average hospital stay, and you'll overestimate — patients who stay longer are more likely to be in the hospital when you survey.6 A disease with a 5-day average duration might appear to last 7 or 8 days when you sample current patients. Public health officials have learned to correct for this, but the correction is subtle and often forgotten.
Unemployment studies: Survey the currently unemployed about duration of unemployment, and you'll oversample the long-term unemployed. The average unemployment spell as measured by a point-in-time survey is much longer than the average spell as experienced by a newly unemployed worker. This has profound implications for labor market policy — the "typical" unemployed person in cross-sectional data is not typical of the unemployment experience.
Web browsing: Study "time spent on webpage" by checking what page users are on at a random moment, and you oversample slow readers. A website might find that users "typically" spend 4 minutes on a page, while the median user actually spends only 90 seconds. The heavy tail of very slow readers pulls the inspected average upward.
The Paradox of Life Expectancy
Here is perhaps the most consequential application of the inspection paradox: human lifespans themselves.
Suppose you read that the average life expectancy in a certain country is 75 years. You might reasonably conclude that a randomly chosen 40-year-old has about 35 years left to live. But you'd be wrong — they probably have more. Why? Because the 40-year-old has already survived the dangerous early years of life. They've passed through the infant mortality window, the risky childhood diseases, the accident-prone teenage years. The very fact that they're 40 selects for longevity.
This is the inspection paradox applied to survival analysis. When you sample a living person at a random time, you're more likely to sample someone in a long life than a short one. The short lives have already ended; they're not in your sample.
The mathematical machinery for handling this is called survival analysis or event history analysis, and it's essential in demography, epidemiology, and actuarial science. Life insurance companies make their profits by understanding this paradox deeply. They know that a 70-year-old in good health has a life expectancy that exceeds what crude averages would suggest, because that 70-year-old has already demonstrated an ability to survive.
A 100-year-old has already beaten the odds many times over. Their expected remaining lifespan — perhaps 2-3 more years — is significantly higher than the life expectancy of a newborn in a population where many die young, even if the population average is 75. Each year survived is evidence of underlying resilience.
The same logic applies to product reliability. A lightbulb that has already burned for 1,000 hours is likely to last longer than a fresh bulb from the same factory, assuming the failure rate increases with age (as it usually does for mechanical devices). This is why "burn-in" testing works: you run devices for a short period to weed out the early failures, and what remains is a selected population with longer expected lifespans.
But be careful — the direction of the bias depends on whether the hazard rate is increasing or decreasing. For humans, infant mortality creates a decreasing hazard after early childhood. For products with "infant mortality" failures followed by a stable period, the surviving products actually have lower failure rates than new ones. The inspection paradox cuts both ways.
The Long Run and Other Misdirections
There's a classic gambling puzzle that illuminates the inspection paradox from another angle. Imagine a roulette wheel. You observe it for a while and notice that red has come up five times in a row. A gambler might think: "Black is due!" But the wheel has no memory; the probability of black is still 18/37 (or 18/38 on an American wheel). This is the gambler's fallacy, and most people learn to avoid it.
But now consider a different question. You're walking past a casino and see a roulette wheel. You don't know how long it's been spinning. You look up and see that it's showing red. What is the probability that the current streak of red is longer than average?
The answer is: more than 50%. You're more likely to observe a long streak than a short one because long streaks occupy more time. This isn't the gambler's fallacy — it's the inspection paradox again. The streak you're witnessing, whatever its color, is likely to be longer than the average streak. If you sit down and bet on the streak continuing, you're making a mistake. But if you're just observing the current state, you're seeing a selected sample of longer-than-average events.
This explains why the "hot hand" in basketball feels so real. When you watch a game and see a player hit three shots in a row, you're witnessing a selected streak. The probability that this particular streak continues is no higher than chance — but the fact that you're observing a streak at all means it was already longer than most sequences of shots. The fan who arrives at the game and sees a player "on fire" is experiencing length-biased sampling of shooting sequences.
The late psychologist Amos Tversky (working with Thomas Gilovich) famously debunked the hot hand fallacy in basketball, showing that players' shooting percentages after made shots were no higher than after missed shots.8 But the inspection paradox suggests that fans aren't entirely wrong to perceive streakiness — they're just wrong about what it means. The streaks they observe are longer than average; they just don't predict future performance.
The Deeper Lesson
The inspection paradox is uniquely insidious because it doesn't feel like a bias. When you wait 15 minutes at a bus stop, you don't think "I've been length-biased sampled." You think "This bus system is terrible." When you look around your lecture hall of 200 students, you don't think "I'm experiencing a size-weighted distribution." You think "This university lied about class sizes."
The paradox is a bias that disguises itself as lived experience. And because it's baked into the act of observation itself — not into the system being observed — no amount of fixing the system can make it go away.
The MTA could run a perfectly calibrated 10-minute average schedule, and your experience would still be that buses take forever. The university could have a genuine average class size of 20, and your classes would still feel big. The only way to eliminate the inspection paradox would be to eliminate variation — to run buses exactly every 10 minutes with mechanical precision, to require all classes to have exactly 20 students. But variation is the nature of reality. Buses get stuck in traffic. Students don't distribute themselves evenly.
Your experience of a system is not the same as the system's average behavior. Not because you're unlucky, and not because the system is broken, but because the act of experiencing the system — of arriving at a random moment and observing what's happening right now — introduces a systematic distortion.
Once you see this, you see it everywhere. In customer satisfaction surveys (who fills them out? People with extreme experiences). In the misleading intuition that "things used to be better" (you remember the hits, not the forgotten failures — survivorship bias and length bias together). In the perception that your commute is always worse than average (the worst commutes take longer, so you're more likely to be experiencing one when you check the time).
Even our perception of time itself may be subject to inspection effects. The "psychological present" — the window of consciousness within which we experience the now — is itself a sample. Are we more likely to be conscious during long moments than short ones? Does the inspection paradox operate on subjective time?
The mathematician's answer to "why is the bus always late?" isn't a complaint about public transit. It's a warning about the gap between the world as it is and the world as you experience it. It's a reminder that observation is not passive — it is an intervention that changes what you see.
In the end, the inspection paradox teaches us humility. Our experience is real, but it is not representative. The world we navigate is filtered through the lens of our particular moment of arrival, our specific position in the network, our unique slice of time. To understand the system, we must look beyond our own experience. We must count the intervals, not just feel the wait. We must sample randomly, not just look at our friends. We must measure the population, not just the patients in the hospital right now.
The math isn't broken. Your sampling is. And knowing that is the first step toward seeing clearly.