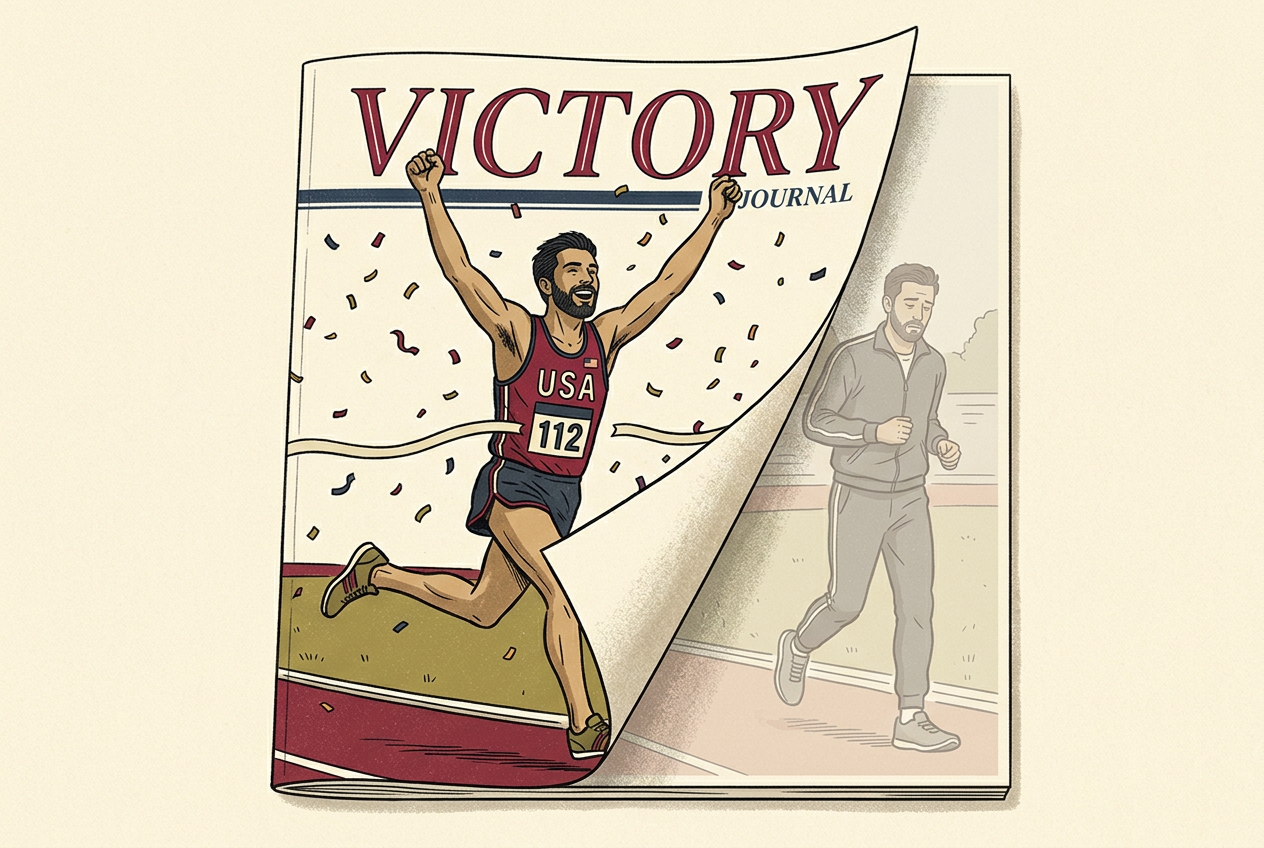
The Sports Illustrated Cover Jinx
In January 2002, Barry Bonds grinned from the cover of Sports Illustrated, fresh off his record-smashing 73-home-run season. The following year, he hit 46. Still excellent — Hall of Fame excellent — but fans didn't see it that way. They saw the jinx.
Athletes who appear on the cover tend to perform worse afterward. Eddie Mathews on the first-ever cover? The Braves went on a losing streak. Madden NFL players on the box? Slumps followed. The pattern is so reliable that sportswriters have written thousands of words about "the curse."
Here's the thing: the pattern is reliable. It's just not a jinx.
An athlete gets on the cover after an exceptional performance — a career-best season, a record-breaking game. And what tends to follow an exceptional performance? A less exceptional one. Not because of curses. Because that's what the word "exceptional" means.
Think about it this way: to get on the cover of SI, you need to be not just good, but unusually good. You need your skill to align perfectly with your luck. The bounces went your way. The injuries didn't happen. The opposing pitcher had an off day. All the random variance pointed in the same direction. But luck, by definition, doesn't persist. Next season, the bounces will be random again — sometimes in your favor, sometimes against, but on average, just average. So your performance will regress toward your true skill level, which is still excellent, just not historically excellent.
The "jinx" isn't supernatural. It's mathematical. It's one of the most important ideas in statistics — and almost everyone, including experts, routinely gets it wrong.
Regression to the Mean
The statistical tendency for extreme observations to be followed by less extreme ones. One of the most important ideas in statistics — that almost everyone, including experts, routinely gets wrong. It's not a law of nature; it's a law of probability. Extreme events are, by definition, unlikely. So the next event is likely to be less extreme.
The Sweet Peas of Francis Galton
In the early 1880s, Francis Galton — Charles Darwin's half-cousin, a man so obsessed with measurement that he once made a "beauty map" of Britain by covertly rating women's attractiveness on the streets of various cities — distributed packets of sweet pea seeds to friends across Britain. Each packet contained seeds of a single measured size. He asked them to grow the plants and send back the offspring seeds.1
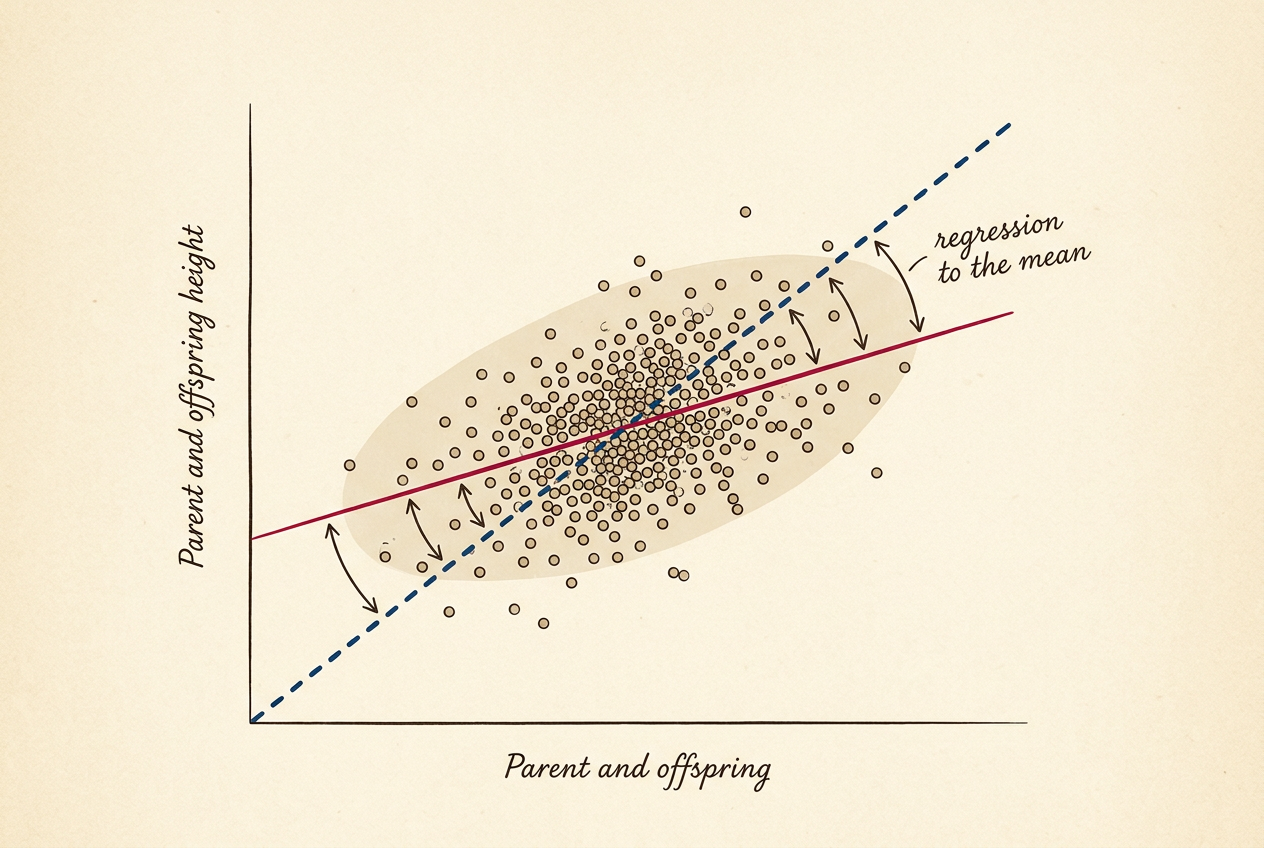
The offspring of large seeds were, on average, less large than their parents. The offspring of small seeds were, on average, less small. The children were closer to the overall average. Large parents had slightly-smaller children; small parents had slightly-larger children. The extremes softened toward the middle.
Galton called this "regression towards mediocrity." In 1886, he published his landmark study of human heights, plotting midparent height versus child height.2 The result was the same: tall parents had tall children, but not as tall as themselves. Short parents had short children, but not as short. The slope of the regression line was less than 1 — meaning that for every inch taller the parents were above average, the children were only about two-thirds of an inch taller.
Signal, Noise, and the Illusion of Change
Here's what Galton discovered that nobody had put into words before: every measurement is a mix of signal and noise. Your height, your test score, your batting average, your company's quarterly earnings — each is partly determined by your "true" underlying ability (the signal) and partly by random chance (the noise).
Imagine a classroom of 100 students taking two exams. Each student has a "true ability" — but each exam also involves luck:
The Measurement Equation
Score = True Ability + Noise
Every measurement contains signal and random variance
Who scored highest on Exam 1? Probably someone with high true ability and good luck. Both had to line up. They knew the material, yes, but they also happened to study exactly the topics that appeared on the test, they got a good night's sleep, they didn't have a fight with their partner that morning, the temperature in the room was comfortable, and they didn't have to sneeze during the difficult problems. Luck, in other words, was on their side.
But on Exam 2, their luck will be freshly random — sometimes good, sometimes bad, but on average, just average. So their score will probably be lower. Not because they got worse. Not because they peaked too early. Not because of hubris or complacency. Because their luck stopped being exceptional.
This is the heart of regression to the mean. It's not about getting worse. It's about extreme outcomes being unsustainable because they require both skill and luck, and luck doesn't persist.
Regression Simulator
Adjust the signal-to-noise ratio and watch how regression changes.
Top 20 Period 1
Bottom 20 Period 1
The Regression Fallacy: Where It Hurts
Daniel Kahneman tells a story that might be the single best illustration of why regression to the mean matters in the real world. Early in his career, he was teaching flight instructors about training psychology. He told them that rewarding good performance is more effective than punishing bad performance — a well-established finding from behavioral research.3
"I've often praised cadets for a beautifully executed maneuver, and the next time they do worse. And I've screamed at cadets after a terrible landing, and the next time they do better. So don't tell me that reward works better than punishment — my experience proves the opposite."
The instructor was absolutely right about his observations. After a great landing, the next one was usually worse. After a terrible landing, the next one was usually better. He was completely wrong about the cause.
A "great landing" — one that stands out as exceptional — requires both skill and luck. The wind cooperated. The plane responded perfectly. The pilot's caffeine level was optimal. A "terrible landing" similarly requires bad luck: a gust of wind, a momentary distraction, a mechanical hiccup. On the next attempt, the luck resets to average. So the great landing is followed by a merely good one, and the terrible landing is followed by an acceptable one.
The instructor's experience was real. His explanation was fiction. This is the regression fallacy: attributing a causal explanation to what is, in fact, a statistical inevitability. And it's everywhere.
In medicine: When do you go to the doctor? When you feel terrible — when symptoms are at their worst. Almost any treatment will be followed by improvement. This is one reason the placebo effect is so robust: patients seek treatment at peak illness, and regression does the rest. The cold medicine "worked" because you took it when your cold was worst, and colds naturally get better.4
In schools: A school has a terrible year on standardized tests. The district intervenes with a new curriculum, extra tutoring, perhaps a new principal. The next year, scores improve. The intervention "worked"! Except the school was flagged because it had an unusually bad year — a combination of weaker-than-average students and bad luck — and some bounce-back was inevitable regardless of the intervention.
In business: A division has a disastrous quarter. The CEO fires the division head. Next quarter, results improve. The firing "worked"! Or did the division simply regress to its long-term average after an unusually bad period?
The Triumph of Mediocrity (and Its Demolition)
In 1933, economist Horace Secrist published The Triumph of Mediocrity in Business — 468 pages of meticulous research showing that the most successful businesses become average over time, and the least successful also become average. Everything converges to mediocrity. The book was a sensation. Business schools took notice. Secrist had apparently discovered a fundamental law of capitalism: competition inevitably erodes all advantage, dragging everyone toward the middle.
Harold Hotelling, a statistician at Columbia, wrote a devastating review. The "convergence" Secrist observed was nothing more than regression to the mean. If you select companies by extreme performance in one period and watch them in the next, they will always regress toward the average — not because mediocrity triumphs, but because extreme performance was partly luck, and luck doesn't persist.5
Secrist hadn't discovered a law of competition. He had discovered a law of probability — and mistaken it for economics.
The Second-Year Slump
Every sports fan knows about the "sophomore slump." A rookie comes out of nowhere, has a spectacular first season, wins Rookie of the Year, appears on magazine covers, signs endorsement deals. Then, in year two: mediocrity. What happened? Did success go to their head? Did they stop working as hard? Did opponents figure them out?
Maybe. But probably not. Probably, it's just regression to the mean wearing a different costume.
Here's how it works: to win Rookie of the Year, you need to have an exceptional rookie season. Exceptional means better than your true skill level would predict — because "exceptional" literally means "unusually good." It requires your skill plus good luck. Maybe you stayed healthy while your competitors got injured. Maybe you got more playing time than expected because a veteran was traded. Maybe the ball just bounced your way more often than statistics would predict.
The next year, your skill is the same (or better, since you have more experience), but your luck reverts to average. So your performance regresses toward your true level. You're not worse — you're just no longer the beneficiary of extraordinary good fortune.
This pattern appears everywhere we select extreme performers and watch them over time. The "best new restaurant" often disappoints on your second visit. The "hottest stock" of last year often cools off. The "most improved student" often slides back. In each case, we mistake statistical fluctuation for meaningful change.
Consider a basketball coach who wants to reward effort. He gives a "Most Improved Player" award to the athlete whose scoring average increased the most from last season to this season. The next year, that player's improvement almost always shrinks or reverses. Did they stop trying? No — they were selected because they had an unusually good year, which was partly luck, and the luck didn't continue. The award, in a sense, predicts future regression.
The sophomore slump isn't about psychology. It's about statistics. When you select someone for having an exceptional year, you're selecting someone who likely had exceptional luck. And luck, by definition, doesn't last.
The CEO Rotation Trap
Here's a pattern that plays out in boardrooms across America: A company has a terrible year. Profits down, stock price tanking, shareholders angry. The board fires the CEO and brings in a new leader with a bold vision. The next year, results improve. The new CEO is hailed as a turnaround artist, featured in business magazines, given a massive bonus.
But wait. Let's look closer.
The company was doing terribly — so terribly that the CEO was fired. That means the company was at an extreme low point. And what follows extreme low points? Regression toward the mean. Even if the board had hired a potted plant as CEO, results would likely have improved simply because the company's bad luck didn't persist.
Thomas Schelling, the Nobel Prize-winning economist, called this the "fortune of the replaced executive." The fired CEO gets blamed for bad luck. The new CEO gets credit for regression to the mean. Everyone thinks they witnessed a turnaround when they really witnessed statistics.6
This dynamic explains why CEO turnover is so high and why new executives are so often hailed as saviors: we're constantly replacing people at the trough of a cycle and attributing the inevitable recovery to their leadership. The reverse happens too — a CEO who presides over a record year is often followed by disappointment, not because they suddenly got worse, but because the record year was partly luck.
The lesson isn't that CEOs don't matter. They do. But their impact is often smaller than we think, and much of what looks like executive skill is actually regression doing its silent work.
The Curse Detector Game
Your turn: can you tell when a change is real versus when it's just regression to the mean?
🔮 Curse Detector
Real skill change or just statistical regression? You decide.
Loading...
Why Your Brain Hates This
There's a reason regression to the mean is the most important statistical concept you've never heard of. It's invisible. It makes no noise. It produces no headlines.
Every individual case of regression looks like a story — a rise, a fall, a comeback — and your brain is a story machine. It wants causes. It wants narratives. It evolved to spot patterns and assign agency, not to appreciate statistical artifacts.
"She peaked too early." Maybe. Or she was lucky in her first competition.
"He couldn't handle the pressure." Maybe. Or his first season was a statistical outlier.
"The treatment worked." Maybe. Or you sought treatment when symptoms were worst.
"The policy failed." Maybe. Or the school was flagged because it had an unusually good year.
This is why the regression fallacy persists despite being well-understood by statisticians for over a century. Our brains are not built to accept that much of what happens is random. We want to believe that success comes from effort and failure comes from mistakes. And sometimes it does! But distinguishing skill from luck requires looking at many cases over time, not one dramatic story.
The Galton Squeeze
Galton was disturbed by his discovery. If tall parents have slightly-less-tall children, shouldn't the whole population collapse into a single height? The distribution of heights today is roughly as spread out as in Galton's day.
He realized: regression works in both directions. The children of tall parents are less tall — but the parents of tall children are also less tall than their children. Tall children come from both tall parents who regressed down and medium parents whose children regressed up.7
Key Insight
Regression to the mean doesn't shrink the distribution. It doesn't mean the world is getting more boring, or that excellence is temporary. It means that your best prediction for an individual's next performance, given an extreme current performance, should be closer to the average.
The Sports Illustrated jinx isn't a curse. It's the universe reminding you that exceptional performances are, by definition, hard to repeat. The athlete hasn't gotten worse. They've gotten normal.
Learning to prefer the boring-but-right explanation over the exciting-but-wrong one — that might be the most important statistical skill there is.8