In 1973, UC Berkeley admitted 44% of male applicants and 35% of female applicants. Slam-dunk discrimination case — until statisticians broke the data down by department, and the bias reversed. Women were admitted at higher rates in four of the six largest departments.

The Berkeley Bombshell
Here's the thing about data: it can tell you two opposite stories at the same time, and both of them can be true.
In the fall of 1973, the University of California, Berkeley had a problem. Not a math problem — a legal one.
That year, 8,442 men applied to Berkeley's graduate programs. Of those, 44% were admitted. Meanwhile, 4,321 women applied. Only 35% got in.1 A nine-percentage-point gap. In a vacuum, this is a slam-dunk discrimination case. The numbers don't lie. Women were being admitted at a significantly lower rate than men.
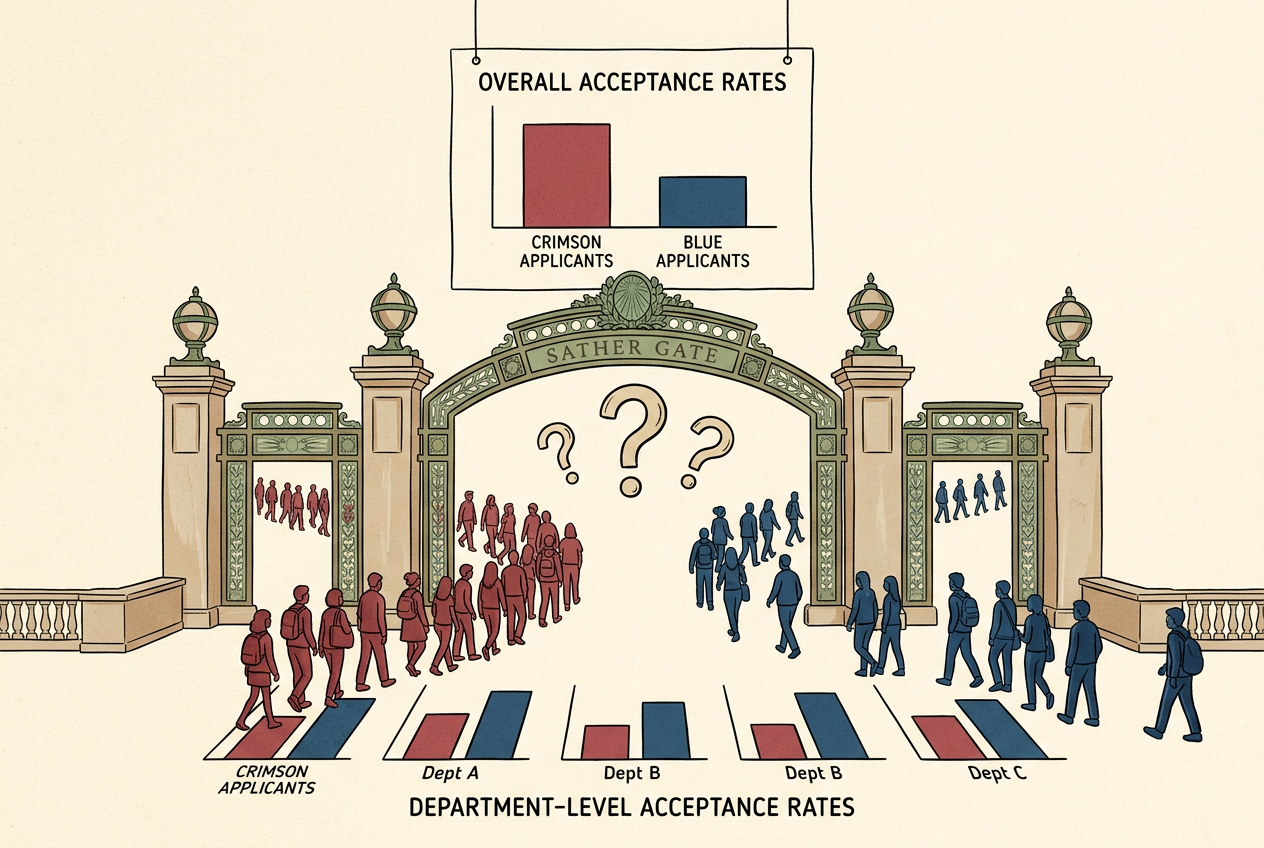
The university hired statisticians. Peter Bickel, Eugene Hammel, and J. William O'Connell got the data and did what any careful analyst would do: they broke it down by department.
And the discrimination vanished.
Not just vanished — reversed. In four of the six largest departments, women were admitted at a higher rate than men. Department A admitted 82% of female applicants but only 62% of males. Department B: 68% of women, 63% of men.2
This is Simpson's Paradox. A trend that appears in aggregated data reverses — completely — when you split the data into natural subgroups.
Every time you look at a number — a batting average, a drug trial result, a school performance metric — you're looking at aggregated data. And aggregated data can lie to your face while telling you the literal truth.
How the Reversal Works
Women and men weren't applying to the same departments. Women applied disproportionately to departments in the humanities — small, prestigious, and ferociously competitive. Acceptance rates of 20-30%. Men applied disproportionately to engineering and physical sciences — large departments with rates of 50-70%.
Women do better in both departments, yet worse overall. The sizes of the subgroups create the reversal.
When you compute an overall rate, you're computing a weighted average of the subgroup rates. The weights are the sizes of the subgroups. If one group is concentrated in the low-rate categories, their overall average gets pulled down — even if they outperform the other group everywhere.
Your gut tells you that if something is better everywhere, it must be better overall. Your gut is wrong. "Overall" isn't computed the way your brain assumes.
Simpson's Paradox Builder
Adjust the sliders to see how different distributions create — or destroy — the paradox. Group A is blue, Group B is orange.
Department 1
Department 2
Play with those sliders. What you'll discover is that the paradox isn't some exotic edge case. All you need is for the two groups to have different distributions across the subpopulations. The more uneven the distribution, the easier the reversal.
Simpson's Paradox isn't rare. It's lurking in virtually any dataset that can be disaggregated. The question isn't whether it could be present. It's whether you've checked.
The Kidney Stones That Changed Everything
In 1986, a study compared two treatments for kidney stones.3 The question was simple: which treatment has a higher success rate?
Overall: Treatment A succeeded 78% of the time. Treatment B succeeded 83%. Treatment B wins. Case closed?
For small kidney stones: Treatment A succeeded 93%. Treatment B succeeded 87%.
For large kidney stones: Treatment A succeeded 73%. Treatment B succeeded 69%.
Treatment A was better for small stones. Treatment A was better for large stones. And yet Treatment B was better overall.
Kidney Stone Treatments
Treatment A (blue) vs Treatment B (orange) — notice how the bars flip in the "Overall" group.
Treatment A was used on harder cases (large stones), dragging its overall average down despite winning in both categories.
Doctors tended to use the more invasive Treatment A for the harder cases — large kidney stones. Treatment B was preferentially assigned to easy cases. So Treatment A's overall average got dragged down by handling more of the tough cases, even though it outperformed Treatment B in both categories.
The aggregated statistic would have led to the wrong treatment.
When Should You Trust the Numbers?
Here's the hard question: when should you trust the aggregated data, and when should you trust the disaggregated data?
Because disaggregation isn't always right either. You can always slice data into more subgroups — by department, by year, by subfield, by individual reviewer. At some point, each subgroup has three people and the statistics are meaningless.
Judea Pearl puts it this way: you can't decide whether to aggregate or disaggregate by looking at the data alone. You need a causal model — a story about what causes what.4
The causal story: gender → department choice → admission. Gender influenced which department you applied to, and department determined your admission rate. Department is a confounding variable — causally upstream of both gender and admission. You should disaggregate.
A company pays men more than women overall. Disaggregate by job title and the gap disappears. But if the company systematically channels women into lower-paying roles, then job title is a mediator, and disaggregating by it hides the discrimination. The aggregated data tells the true story.5
Same mathematical structure. Same paradox. Opposite correct answers. The math doesn't tell you which to trust. The causal story does.6,7
Which Data Do You Trust?
Five scenarios. Aggregated and disaggregated data tell opposite stories. You decide which to believe.
The Paradox in the Wild
Baseball. In 1995-1996, David Justice had a higher batting average than Derek Jeter in both years. But Jeter had the higher combined average. Justice played more games in the year both players hit poorly.
COVID-19 mortality. Early pandemic data showed countries with higher vaccination rates had higher mortality. Simpson's Paradox: older people were both more likely to be vaccinated and more likely to die. Within every age group, vaccination dramatically reduced mortality.8
Education policy. SAT scores can rise in every demographic group while falling overall, if the proportion of lower-scoring groups in the test-taking population has increased.
Simpson's Paradox hiding in plain sight across medicine, sports, education, and public health.
The Lesson That Changes Everything
Data is not knowledge. Data is raw material. To turn data into knowledge, you need a story about how the data was generated — a causal model, even if informal and imperfect.
Every time you read a headline that says "Study shows X," the right question isn't just "is the study well-designed?" It's: would this conclusion survive disaggregation? And if the disaggregated data tells a different story, which story is the right one?
You can't answer that second question with more data. You can only answer it with thinking — about what causes what, about what's a confounder and what's a consequence, about the causal architecture of the world.
The women who applied to Berkeley in 1973 weren't the victims of biased admissions committees. They were the victims of something subtler — a world that channeled them toward certain departments, and then punished them for the competitive landscape they found there. The paradox didn't create the injustice. It just determined where you'd find it, if you looked carefully enough.
And that, in the end, is what statistics is for. Not to give you answers. To tell you where to look.